The 2023 NLDS raised a specific problem that ERA could not answer.
The Dodgers finished with the best run differential in baseball that season. Arizona swept them in three games in a best-of-five, with roughly half the Dodger payroll. The first post on this site tried to explain what happened to the bullpen. Three seasons of ground ball and walk rate data told a coherent story about how the Friedman era bullpen was built and how that profile had eroded.
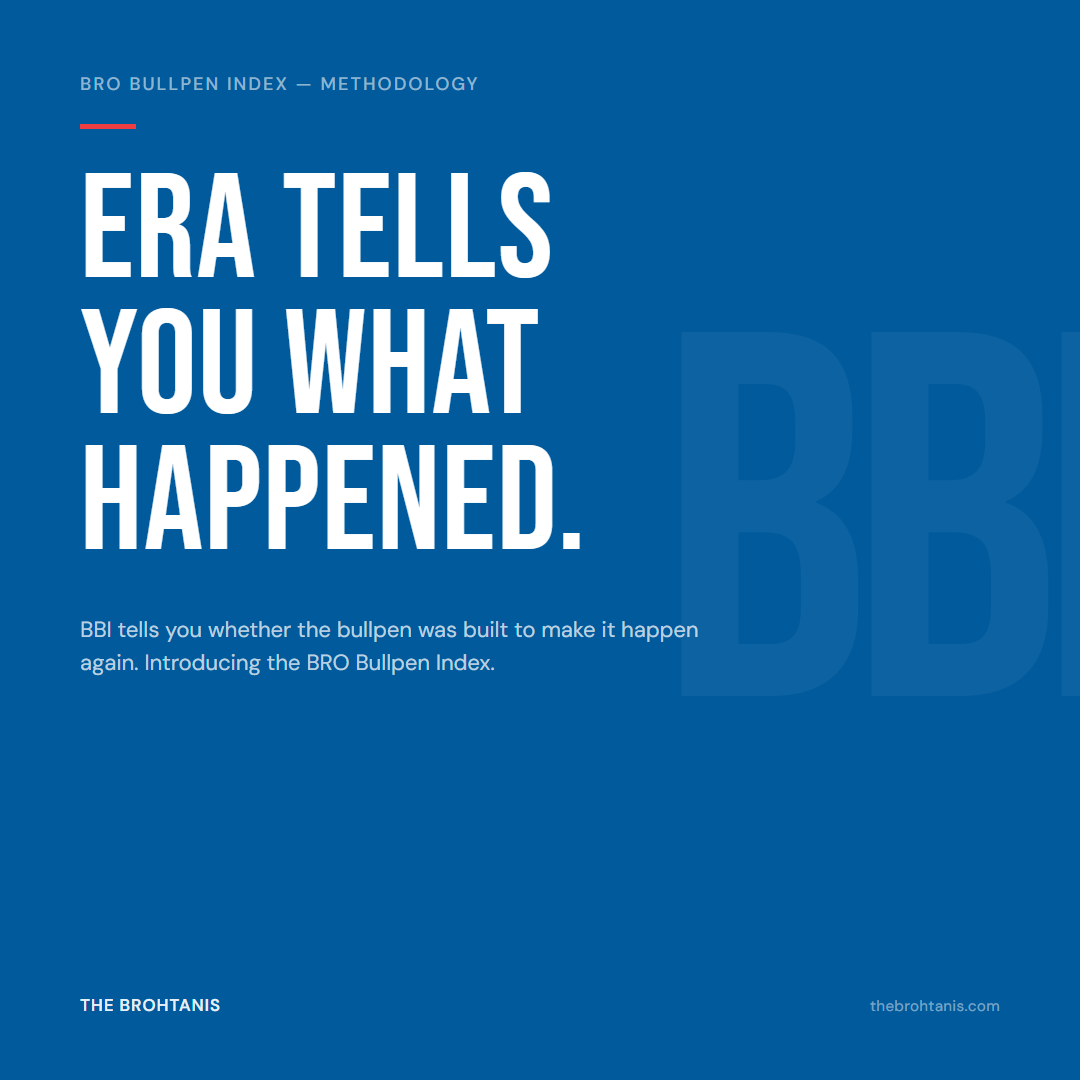
But three seasons of data for one team tells you what happened. It does not tell you whether it is part of a pattern.
The research expanded. Eleven seasons instead of three. Four organizations instead of one. Seasons well before Andrew Friedman arrived in Los Angeles. At each expansion, the same profile appeared. Walk rate discipline as the primary organizational trait. Ground ball orientation as the amplifier built on top. At each expansion, the profile corresponded to measurable ERA outperformance.
BBI is the quantification of that pattern. It did not start as a formula. It started as a question the 2023 NLDS raised. The formula is what the data required once the pattern became undeniable across the expanded dataset.
What BBI Is Not Trying to Do
The BRO Bullpen Index is not an ERA estimator. It does not compete with ERA, FIP, or SIERA. Those tools evaluate individual pitcher quality. BBI evaluates organizational construction quality at the unit level. That is a different question, and the distinction matters before anything else.
A sophisticated fan can filter Fangraphs by team, sort by SIERA, and get a reasonable approximation of bullpen quality. BBI does something that approximation cannot do. It weights the inputs specifically for what the confirmed dataset shows produces sustained ERA outperformance at the organizational level. It applies the ground ball threshold interaction that SIERA treats as linear. And it anchors the result to a specific organizational standard with a confirmed real-world outcome behind it: a -1.002 ERA gap versus league average in 2022.
BBI is additive to public metrics. Not a replacement for them.
The claim is also not that a bullpen built like the 2022 Dodgers is automatically a Dodger bullpen. The claim is that this specific profile of inputs has produced measurable ERA gaps consistently across multiple organizations at different market sizes. The Milwaukee Brewers built the walk rate and ground ball profile in 2023 and produced an ERA gap larger than the 2022 LAD benchmark, on a fraction of the payroll. The Houston Astros produced a comparable ERA gap in 2022 through a different input profile at a comparable payroll level. The profile is real. It is portable. The Dodgers did not invent it. They built the best confirmed expression of it in the dataset.
That is also the difference between constructing a bullpen and assembling one. BBI is not asking whether these pitchers are good. It is asking whether this bullpen is built coherently with a philosophy the data confirms produces sustained outperformance. Those are different evaluations and they do not always agree.
One more thing BBI is not doing: it is not penalizing good ERA outcomes that came from a different construction model.
Some organizations produce strong bullpen ERA through elite individual arms rather than roster-wide walk rate culture. A dominant closer with a 1.8 BB/9 bought at a premium produces real ERA outperformance. BBI scores that bullpen lower than its ERA gap suggests, and that is intentional. The metric is measuring whether the construction approach is philosophically aligned with what the data confirms produces sustained outperformance at the organizational level. It is not measuring whether the ERA was good this year.
A bullpen built around one or two elite individual arms can post an excellent ERA gap. BBI will tell you the construction model that produced it. Whether that model is sustainable through roster turnover is a different question than whether the ERA was real.
How the Ground Ball Component Actually Works
One part of the formula requires a plain-language explanation before the numbers make sense.
The ground ball component is a threshold amplifier, not a linear contributor. Below league average ground ball rate, a bullpen earns no additional penalty for being further below the threshold. The floor applies regardless of how far below league average the rate falls. Ground balls convert to home run suppression only after crossing league average. Below that threshold, ground ball rate improvements do not produce the same ERA outcome.
This is why the formula treats below-average and significantly-below-average the same way. The floor is not arbitrary. It encodes a confirmed real relationship between ground ball rate and home run suppression. The amplification only begins when the threshold is crossed.
What a BBI Score Actually Means
ERA tells you what happened. FIP tells you what a pitcher controlled. BBI tells you whether a bullpen is built to produce sustainable ERA outperformance, not whether it got lucky this month.
There are four combinations to understand.

Every team’s current BBI score is their organizational baseline. Movement toward 100 is movement toward the profile that should produce a -1.002 ERA gap versus league average. Should, not will. The philosophical profile creates the conditions for elite ERA outperformance. The margin of error that philosophy provides is real. Whether any given season converts that margin into outcomes depends on factors the formula does not control..
The 2022 Benchmark

The 2022 Dodger bullpen is the only season in twelve years where all three components aligned simultaneously. Walk rate elite. Ground ball rate above league average. Fielding-independent pitching gate cleared. The ERA gap versus the league that year was -1.002. One full run better per nine innings.
That is why 2022 is the benchmark. It is not arbitrary. It is the one season in the Friedman era where the philosophy produced its best version of itself, confirmed across every input the metric tracks.
Walk rate carries substantially more weight than ground ball rate. The data made that sequencing clear from the first season of the era. Walk rate is the dominant organizational trait, the one that predated the ground ball orientation by three years, the one that held through roster turnover and injuries and multiple seasons of below-average ground ball rates.
One caveat goes into every BBI score published on this site, and it is worth reading once:
BBI scores a reliever’s alignment with the walk rate and ground ball profile, not the run prevention that results from it. The ground ball component assumes league average or better infield defense behind the pitcher. A reliever who induces ground balls in front of a below average infield will not convert that profile into the same ERA suppression, and BBI does not adjust for the defense behind him. BBI measures what the pitcher controls. It does not measure what the defense does with it.
That caveat defines what the metric is and is not claiming. BBI is not telling you this bullpen will post a 2.80 ERA. It is telling you this bullpen is built the right way to give itself the chance.
Why Walk Rate Came First
The first Friedman bullpen in 2015 posted a ground ball rate below league average. That is not a typo. The ground ball identity this organization became known for did not exist yet in 2015. What existed was walk rate discipline.
The 2015 Dodger bullpen posted a BB/9 of 2.782. League average that season was 3.245. Nearly half a walk per nine innings below average, in the first year of the Friedman era, with a below-average ground ball rate and no particular profile otherwise.
The ground ball orientation arrived in 2018. It built on top of the walk rate foundation that was already there.
That sequencing is the reason walk rate carries the most weight in BBI. When you build a formula to measure philosophy alignment, you weight the inputs by how much they actually explain. Walk rate explains more.
The Full Era Score Table
Twelve seasons of the Friedman era bullpen scored against a single benchmark. The 2021 collapse happened with an elite ground ball rate. The 2023 blip happened with an elite walk rate. Both are explained below.

2021 scores 79.5 and ranks 23rd despite posting an elite ground ball rate that season. That is BBI working as intended. The 2021 bullpen’s walk rate collapsed: BB/9 of 4.026 against a league average of 3.738. The ground ball rate was excellent. The walk rate was the worst in the Friedman era to that point. BBI weighted the walk rate correctly and the score dropped 20 points. Ground balls cannot compensate for that. The formula reflects what the data says.
The 2023 Question
The era table shows something that needs explaining. The 2023 BBI scores 101.5, marginally above the 2022 benchmark, and ranks 1st in MLB. If the post-2022 story is one of erosion, why does 2023 score higher than the benchmark year?
This is actually the most useful single illustration of what BBI is measuring.
The 2023 Dodger bullpen had elite walk rates. Brusdar Graterol posted a 1.52 BB/9, one of the lowest among qualified relievers in baseball. The walk rate component of BBI responded accordingly. Ground ball rates were also above league average. On the two inputs BBI weights most heavily, 2023 was genuinely strong.
The 2023 Dodger team ERA gap versus the league was -0.820. The 2022 ERA gap was -1.002. The bullpen philosophy in 2023 was strong. The team outcome was not as strong as 2022. Those two things are not a contradiction. They are the distinction BBI exists to draw.

The reason the outcomes diverged is not in the bullpen numbers. The 2023 rotation posted an ERA of 4.374, the worst in the entire Friedman era. That number did not come from the bullpen. It came from a starting staff that collapsed in the regular season and was not built to survive the NLDS.
BBI does not score the rotation. It scores the bullpen. The 2023 bullpen did what the Friedman philosophy asks of a bullpen. The team around it did not. BBI tells you exactly that, and ERA tells you nothing about the cause.
The 2023 blip is not a flaw in the metric. It is the metric doing its job.
2024 and 2025
From 2023, the scores move in one direction.
94.3 in 2024, 12th of 30. Walk rate advantage narrows significantly. Ground ball rate drops below league average for the first time since 2017.
85.9 in 2025, 21st of 30. The floor of the era. Both inputs reversed simultaneously for the first time in twelve seasons. Below-average ground ball rate and above-average walk rate at the same time. The philosophy profile was, by every BBI input, absent.
The team won championships in both years. BBI does not score October. It scores the philosophy that gives a bullpen its margin in the regular season, and the margin in postseason series where one bad inning ends a team’s year. The 2025 championship happened with a bullpen that had drifted further from the organizational philosophy than any version in Friedman’s tenure.
That is not a criticism of the championships. It is the point the data makes about the margin of error.
BBI as a leading indicator
There is one more thing the score table shows that is worth naming directly before moving to 2026.
BBI has a confirmed leading indicator relationship for organizations that embed the philosophy consistently enough that it persists through roster turnover. The Kansas City Royals are the clearest illustration in the external dataset. Their BBI in 2014 was 87.27. The ERA gap did not open until 2015, when it reached -0.894. The World Series followed that October.
The signal preceded the outcome by one full season.
That relationship does not hold for every organization. It holds for organizations where walk rate discipline is genuinely embedded in how the front office builds the bullpen, not just in which arms happen to be on the roster that year. A single high BBI season does not activate the claim. A sustained multi-season trajectory in the right direction does.
Where 2026 Stands
The 2026 partial BBI is not in this table. Partial-season scores require more innings before they stabilize into a number worth publishing. The July 9 off day snapshot is the target checkpoint.
Walk rate has improved sharply from 2025. Ground ball rate remains below league average. The previous post called it stabilization, not restoration. That framing still holds.
Does the construction signal arrive before the ERA confirms it? That question gets a direct answer in the next post.
The Profile Is Portable
Milwaukee and Houston are the evidence.
The 2023 Brewers posted an ERA gap larger than the 2022 LAD benchmark on a fraction of the payroll. The 2022 Astros produced a comparable ERA gap through a roster built differently, at comparable resources. Neither of those outcomes required a Los Angeles payroll or a Dodger front office.
The formula is also time-stable. The benchmark is fixed to 2022, but the league-relative inputs adjust every season. Bullpens from seasons well before the Friedman era score meaningfully against the same standard. Historically elite bullpens land at the top. Historically poor bullpens land at the bottom. BBI is not a product of the Statcast era or the Friedman era.
The next post runs the full cross-team leaderboard across the league over the Friedman era. Every team scored against the same benchmark. Some of the results are what you expect. Some are not. And the leading indicator question gets answered with data, not speculation.
Leave a Reply