The Dodgers have the best run differential in baseball. Their Pythagorean record says they should be 48-18. They are 42-24. The six-win gap between those two numbers has a cause.
Variance explains part of it. Sequencing explains part of it. The bullpen profile explains the rest.
What the 2023 Bullpen Actually Was
The 2023 Dodger bullpen was not an accident. Two numbers define it.
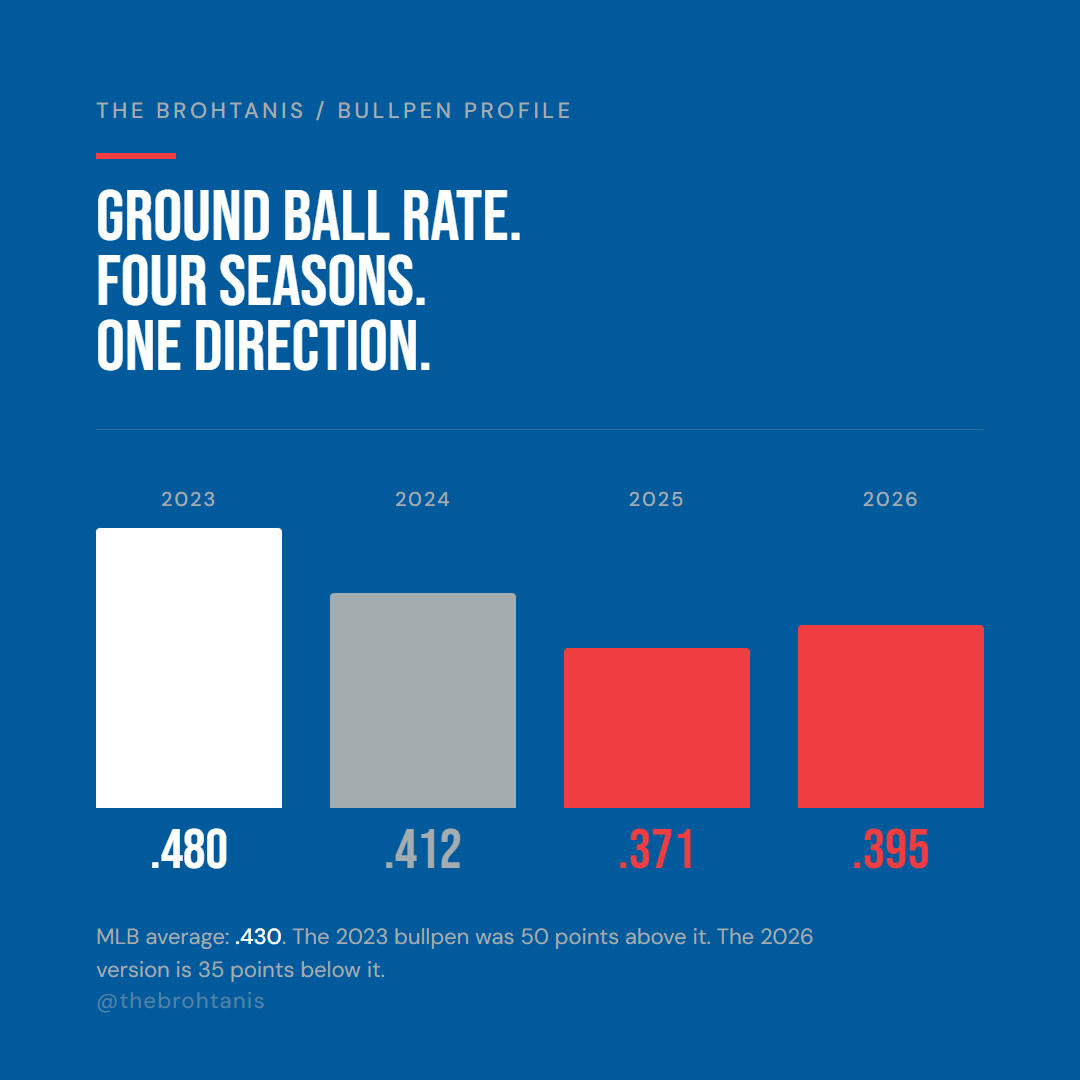
Ground ball rate: .480. League average was .430. The Dodger bullpen was 50 points above league average on the primary contact suppression metric in what is already one of the more pitcher-friendly parks in the league.
Walk rate: 2.57 BB/9. League average was 3.30. Three-quarters of a walk per nine innings below average across an entire bullpen.
Put those together and the output is specific: a home run per fly ball rate of .072. League average was .115. The 2023 Dodger bullpen suppressed home runs at 37% below league average.
Ground balls find fielders. Ground balls do not leave the park. When you walk fewer batters and keep the ball on the ground, the calculus of high-leverage innings changes. A bad pitch becomes a groundout to short, not a three-run shot to left.
The arms that made it work:
| Pitcher | 2023 GB% | 2023 BB/9 |
|---|---|---|
| Brusdar Graterol | .644 | 2.41 |
| Victor Gonzalez | .543 | 3.16 |
| Ryan Brasier | .511 | 0.83 |
| Caleb Ferguson | .491 | 2.84 |
| Evan Phillips | .480 | 2.49 |
The ERA numbers on this group were not sustainable. Graterol at 1.20, FIP 3.03. Brasier at 0.70, FIP 2.48. Shelby Miller at 1.71, FIP 3.68. Phillips at 2.05, FIP 3.16. Fielding independent pitching strips out defense and sequencing luck and gets closer to what a pitcher actually controlled. The ERA was telling a partial story. The ground ball profile was the real one.
2024: The Championship Bullpen Was Already Drifting
The Dodgers won the 2024 World Series. That context matters because the profile erosion did not begin after the championship. It was already happening before it.
By 2024 the bullpen’s average ground ball rate had declined to .412. Still near league average, but .068 below the 2023 benchmark. The walk rate had climbed to 3.20 BB/9, nearly two-thirds of a walk per nine innings worse than 2023.
Graterol missed the season with back surgery. Gonzalez, Brasier, and Ferguson were gone. Their replacements were good pitchers. They were not ground ball pitchers.
The championship staff compensated. Glasnow and Yamamoto provided rotation length. Treinen and Kopech provided reliability in the highest-leverage spots. The team ran strand rates that did not need to be sustainable over 162 games. They needed to hold for 15 postseason games. They did.
The profile shift was already underway.
2025: The Bottom
This is the number that does not appear in any summary of the 2025 World Series run.
The 2025 Dodger bullpen posted an IP-weighted ground ball rate of .371. League average was .430. The 2023 benchmark was .480.
Walk rate: 4.19 BB/9. League average was 3.30. The 2023 benchmark was 2.57.
Home run per fly ball rate: .123. Above league average. The 2023 number was .072.
Here is what four seasons of drift looks like in two columns.
| Season | Avg GB% | vs MLB | Avg BB/9 | vs MLB | HR/FB |
|---|---|---|---|---|---|
| 2023 | .480 | +.050 | 2.57 | -0.73 | .072 |
| 2024 | .412 | -.018 | 3.20 | -0.10 | n/a |
| 2025 | .371 | -.059 | 4.19 | +0.89 | .123 |
| 2026 | .395 | -.035 | 3.58 | +0.28 | n/a |

The 2025 bullpen allowed home runs above league average. The 2023 bullpen suppressed them at 37% below it. That gap represents an enormous change in the team’s ability to limit damage in the innings that matter most.
The Dodgers won the 2025 World Series anyway. Muncy’s eighth inning home run. Rojas in the ninth. Will Smith in the eleventh. The bullpen profile degradation did not prevent a championship. The strand rates held for 15 postseason games. They did not need to be sustainable. They needed to hold. It meant the margin for error in October was narrower than it looked from the outside.

2026: Stabilization Is Not Restoration
The 2026 partial season numbers show modest improvement over 2025. Ground ball rate is up from .371 to .395. Walk rate is down from 4.19 to 3.58. Both are still below league average. Both are still worse than the 2023 benchmark.
Tanner Scott: .392 GB%, 2.84 BB/9. His walk rate is the best part of his profile. His ground ball rate is not.
Alex Vesia: .286 GB%, 3.32 BB/9. A fly ball arm in a bullpen that was built on ground balls.
The 2023 profile has not returned. What has happened is that the 2025 floor has held and the numbers have stopped getting worse. That is different from the problem being solved.
What the Pythagorean Gap Is Telling You
The Dodgers are outscoring their opponents by 133 runs through 66 games. By run expectation, they should be 48-18. They are 42-24. Six wins of underperformance.
No single cause explains the full gap. The bullpen profile is part of the answer. A bullpen that allows above-average home run rates in high-leverage situations compresses the value of large run differentials in individual games. A seven-run win counts the same in the standings as a one-run win.
A fly ball bullpen in a tie game in the seventh inning is a different problem than a ground ball bullpen. The 2023 version knew how to get out of those innings. The 2026 version gives them away at a rate the 2023 version did not.

What It Looks Like in a Box Score
Two games from the first week of June make the abstract concrete.
June 4 at Arizona. The Dodgers trailed by one in the eighth. Alex Vesia entered in the highest leverage situation of the game, leverage index 4.73. Geraldo Perdomo singled to center. Game over. Ketel Marte’s walk-off in the ninth was the punctuation. Perdomo’s single was the sentence.
June 7 at home against the Angels. The Dodgers trailed 6-1, fought back to 5-6 on a Dalton Rushing three-run homer and a Ryan Ward solo shot in the sixth. They were one run down with six outs to play with. Jordan Hernandez entered the seventh. Nolan Schanuel walked to lead off. Jo Adell homered two batters later. Win probability swung 19.1 points in LAA’s favor. The game was effectively over. Hernandez allowed 6 runs in 1.2 innings on the day.
Two games. Two leads or near-leads evaporated in a single inning. A ground ball bullpen limits the damage in those moments. A fly ball bullpen gives the inning away. The 2023 version knew how to get out of those innings. The 2026 version has not.
What a Restoration Requires
To get back to the 2023 profile, you need relievers with ground ball rates above .470 and walk rates below 3.00 BB/9, both simultaneously. At that combination you are looking at a short list.
The trade deadline is late July. The Dodgers have the payroll capacity to add. The question is whether the front office reads the bullpen profile as the correct diagnosis of the Pythagorean gap.
One acquisition does not undo three seasons of drift. It starts to correct it. In a five-game series, the difference between a .480 ground ball rate bullpen and a .371 one is not theoretical. It is baserunners. It is home runs. It is which team is still playing in November.
The 2023 Dodgers built something specific. They won two championships while it eroded. The 2026 version is competing with a bullpen that no longer resembles the philosophy that produced those results.
The run differential says this is the best team in baseball. The bullpen profile says the margin is smaller than it looks. Both things are true.
The BRO Bullpen Index (BBI developed by Xavier Alatorre at The Brohtanis) will score every current Dodger reliever against the 2023 benchmark in August. The raw numbers above are the directional read until then.
Some of the 2026 numbers were calculated around June 4 when this post was an outline and before being written.
Leave a Reply